Cloud services are growing rapidly worldwide. To service all our great apps and the data they contain, massive investments are made to ensure the reliability of these ever-increasing compute platforms. However, the impact on the environment cannot be overlooked in our quest to build "The World's Computer." To help us navigate this unknown terrain, Microsoft has announced the general availability of the Microsoft Emissions Impact Dashboard, a tool that allows Microsoft cloud customers to understand, track, report, analyze, and reduce carbon emissions associated with their cloud usage.
New insights with the calculator and dashboard
Earlier, Microsoft introduced the Microsoft Sustainability Calculator designed to help customers gather meaningful, shareable information. The Emissions Impact Dashboard extends this by adding critical insights to help organizations make more informed, data-driven decisions about sustainable computing.
Organizations can measure the impact of cloud usage on their carbon footprint. The dashboard also enables customers to enter on-prem or traditionally hosted workloads and get an estimate of emissions savings from migrating to the Microsoft cloud.
Functionalities of the dashboard
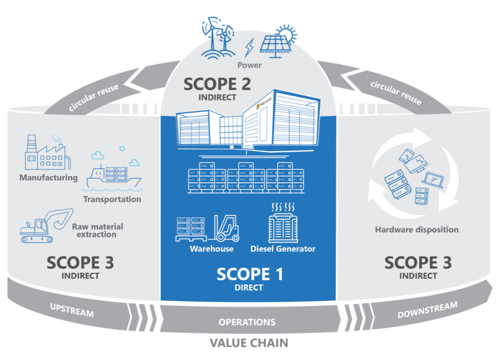
- Consistent and accurate carbon accounting to track greenhouse gas emissions associated with using Azure and other Microsoft cloud services;
- Allow decision-making by comparing actual cloud usage with emissions avoided over time through Microsoft datacenter efficiency;
- Offer estimates for further emissions reductions through moving additional apps and services to the cloud.
Requirements for getting started with the Emission Impact Dashboard
- The Emissions Impact Dashboard runs on Power BI Pro. Get the Power BI Pro free trial.
- The Emissions Impact Dashboard supports all modern Azure subscription types. Your Enrollment ID or Billing Account ID and Admin access are required to connect your company data to the calculator. For more info on how to connect the calculator, visit this site.
3 reasons for using the dashboard
Even if you are not required to connect your company data to the calculator, it might still be helpful to do so. These are some of the reasons why you can start with monitoring your emission in the dashboard.
- Lower costs
When you know you have excessive energy usage or other inefficiencies, you can act on it immediately, which allows you to be more efficient and cost-effective.
- Increase trustworthiness for your brand
If you start measuring and reducing your carbon emissions and share this data with your employees, partners, and clients, you are more transparent. People care more and more about who they are doing business with these days. And if you are working on reducing your emissions, it might work in your favor.
- The importance of reducing your emission won't decrease
Research shows that the importance of sustainability awareness is likely to grow. There is even a demand for more sustainable alternatives in the B2B sector (NielsenIQ, 2018). Companies that don't keep track of their emissions now will probably have to start soon.
Get started
Find more information about the dashboard here or get started immediately.