We’ve had several articles about the different features that Azure provides with regards to IoT. But how does that all stitch together? In this article, we’ll discuss a reference architecture as Microsoft provides them. These might look very complicated when you have had no introduction into the world of Internet of Things but hopefully, you’ll have sufficient knowledge now that you’ve read the previous articles (of course you did!) 😊
Let’s look at one of the reference architectures that Microsoft Provides:
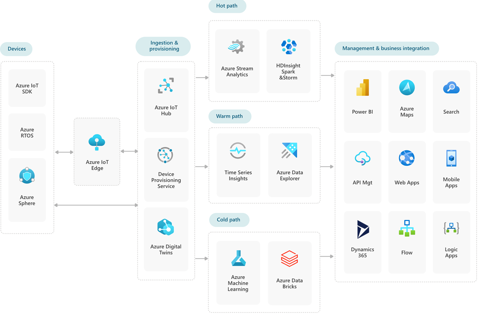
Source: Azure IoT reference architecture - Azure Reference Architectures | Microsoft Docs
That looks like a lot! And that’s true. What we’ve focused on in the different articles is the use case for IoT, IoT Edge, and IoT Hub. Yes, we did discuss devices but not went into technologies such as Azure Sphere (which is an interesting technology to read upon!). Essentially, what we’ve been talking about up until now would be best visualized like so:
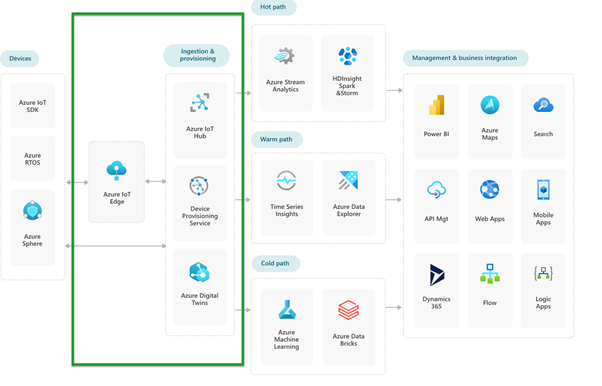

And there is a reason for that. If your solution contains the Internet of Things, the very basic things you need are described in the previous articles. Implementing these basics will open you up to numerous use cases.
But where do you go after implemented the basics like we just mentioned?
Let’s say you’ve got a bunch of devices connected, are transmitting data through IoT Hub and now you want to work with it. You have several options. Microsoft classifies these into different categories:
- Hot Path.
- Warm Path;
- Cold path.
That sounds very cool but why do you have to decide on different paths? Well, it has everything to do with how you want to present the results, how fast you want to do that, and how you want the access to be provided.
Hot path: Real-Time analytics
If you need data to be processed as fast as possible and you want to perform real-time analytics then Azure Stream Analytics is the service you are looking for. With Azure Stream Analytics we can analyze the data ingested from the IoT devices in real-time (of course it’d be helpful if your device sends data in real-time). Think about traffic analysis, point of sale data (inventory control), or any telemetry that you need to process in real-time. If we look at the examples in the previous articles where we talked about temperature, maybe you want to provide the building manager with a tool that allows the manager to see the sensor data in real-time and use the query language (Stream Analytics Query Language) to find interesting patterns. Perhaps someone is leaving the window open in a specific office. That could very well be a use case for Azure Stream Analytics.
Please note: The building manager doesn’t need to understand the query language, one can build these and present the result in a PowerBi Report.
Warm path
When we’re talking about the warm path, we’re usually talking about Time Series Insights. We’re currently at Time Series Insights Gen 2. It’s not as “real-time” as Azure Stream Analytics but it does come with a huge use case. We also refer to this as “near real-time analysis”. I would dare to assume that Time Series Insights is one of the most used technologies when working with data from IoT devices. We’re talking about an end-to-end analytics service. If we stick to the temperature example; time-series insights could be used to visualize and inspect the average temperature in different rooms. It’s not so much about finding patterns in data (as opposed to Stream Analytics) but more about analyzing the data. Another difference is that Time Series Insights acts as a data store whereas Stream Analytics does not.
It is a very common scenario where data flows from the hot path to the warm path, performing anomaly detection with Stream Analytics and analyzing the overall picture with Time Series Insights.
Cold path
And this is where the cool technologies come in! Well... The aforementioned technologies are already very interesting but hmm... What if we want to perform some machine learning? Of course, that would mean all the latency requirements out the window, this might take some time (depending on your model).
I know, we’ve discussed a bit of machine learning before but, that was on IoT Edge configuration where one would run a small model on a device to process the data before sending the results to IoT Hub. We’re talking about something different when we talk about the cold path.
All that data, surely you can do something interesting with that. If you have hundreds or thousands of sensors collecting data, why not build a predictive model? For the last time, let’s talk about the temperature. Using all the data we receive from the sensors through IoT Hub we could build a model, train it, and publish it as a web service for querying to predict the temperature. You probably want to add more variables to be accurate, but the beginning is there!
Presentation
I know I’ve mentioned presenting the data before with Time Series Insights or PowerBi but after you’ve done all your analyses, machine learning, and whatnot, you probably want to create some visualization. That can be done in many different shapes and forms. If you’re doing GPS tracking then Azure Maps might be a great solution or maybe you’re collecting data and creating a database you want to search through, then Azure Search might be your solution. Of course, you can always customize your visualization and use the technologies mentioned in this article as a source for presenting data using App Services or a Mobile App. The goal of this paragraph is not to point you to the right way to visualize your data but to get you thinking.
In your journey through the different paths, you are preparing data (or transforming if you will). You always need to take the bigger picture into account. You probably want to think about this when you start writing your IoT solution; “How do I want to visualize this?”. Because you need clean data, and your data needs to be able to be presented the way you like it to be presented. If you’re doing GPS tracking and all you’re storing is a city name, then you might be in trouble as you probably want the longitude and latitude stored.
Typically, you want to think of the following things when getting started:
- What data can my device store.
- What data do I need for processing in my Hot, Warm, and Cold paths (and do I even want all 3?)
- How do I want to present my data?
Once you can answer those questions, you can look at the different technologies Azure has to offer.
Wrap-up
That’s a lot of information and its purpose is to give you something to think about when designing your IoT solution. It’s not just the device, it’s also what comes after. Building the most epic device that can gather the telemetry you like means nothing if you’re not adding value for the customer by doing something with that telemetry and presenting it in a manner they can use, as input for things like process optimization, building management, or even deciding on when to turn on the lights in the greenhouse.
In conclusion, there’s a lot to think about!